While the analytics tasks so far have been full of subtlety, revenue is easy.
It's binary.
Either someone has given us money or they have not.
There are two options for tracking revenue in PostHog.
Option 1 – Manual revenue capture
Gathering data about revenue can be straightforward: you know exactly when you get paid, and hopefully you can work backwards from that to the precursor events you should also measure.
Start with the place in the product where money changes hands. Put an event there. In addition, capture metadata using event properties: how much money the customer paid and what they paid for.
If you're selling subscriptions, record the subscription timeframe. If you're selling products, include the products they purchased. For example:
Try to keep property values strictly numeric – months: 12 instead of term: 12_months – to preserve flexibility in building reports later on.
Even if you don't have a lot of variation in what you're selling at first, record the details now so that later expansions, experiments, or sales compare easily with historical data.
Now, let's think about the critical path before payment happens. What are the stages or actions that are impossible to bypass to make a purchase?
These should have events tracked as well. Again, adding metadata to the event properties can help build better reporting and answer questions in the future.
If we've got an upsell or call to action that lists a specific price, that's great to include as an event property
Option 2 – Automating revenue capture with data warehouse
Even at the earliest stages of a business, data can be scattered between multiple services, forcing you to constantly open multiple browser tabs just to keep up, which means your events might not give you all the data you need.
Instead of setting up complex event-sending pipelines, you can bring the data directly into PostHog's data warehouse and analyze it all from there.
PostHog's data warehouse solves this problem by aggregating multiple data sources. Your dashboards can then report everything captured from data warehouse and analytics events in a single view. You can even build insights that traverse both.
You can query anything from your app database with data warehouse. Data warehouse also provides quick setup for ongoing capture of revenue events from Stripe and Chargebee.
Just don't forget to capture the events leading to revenue.
How will you report revenue?
- Data warehouse?
- Manual events?
Which events are revenue-generating? Are they already tracked, or do you need to add additional tracking to capture them?
Revenue reporting
With revenue logged, we can build reports to understand how much revenue is captured over time. This is a great way to understand the health of a business.
A trends insight is a great start for your revenue reporting:
- Create a new trends insight
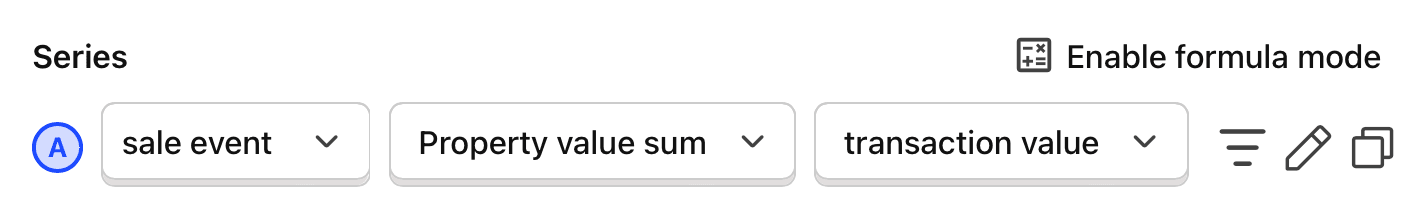
- Edit the series to choose your revenue-bearing event
- In the aggregation menu to the right of the selected event, choose property value > sum
- In the rightmost menu, choose the property that captures the revenue from your event
It will look like something like this:
From here we can choose the timespan for the report, grouping anywhere from hourly to monthly, with comparisons to the previous period if helpful.
Your product in one dashboard
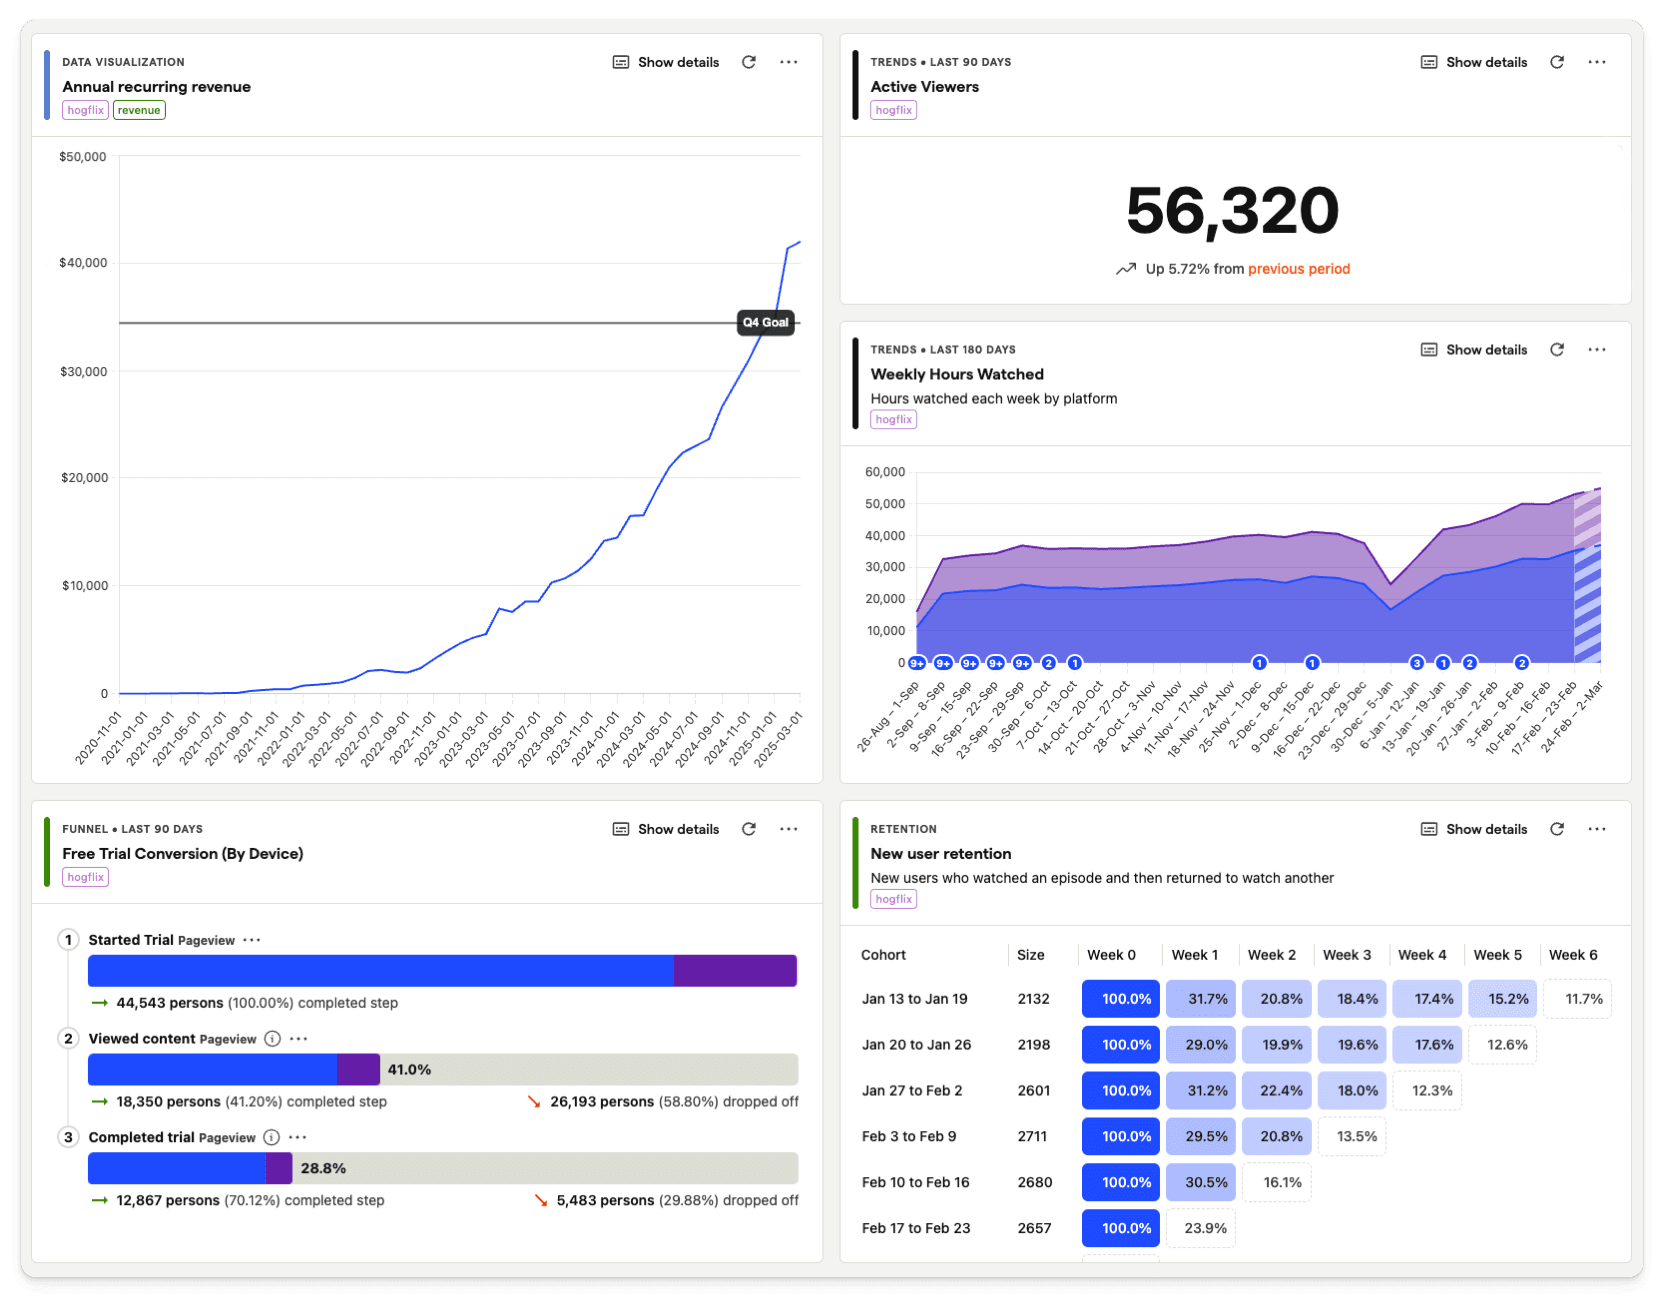
With revenue and all your key events captured, you can build a dashboard like this that covers:
- Growth of daily, weekly, or monthly active users
- Conversion from sign up to activation
- Retention of users after they activate
- Revenue trends relative to your goals
In other words, everything that's important to your business.
Next steps
Growing your product and revenue is an infinite game, and PostHog gives you all the tools you need to play. Some things you can try:
- Get feedback and book user interviews with surveys
- Investigate user friction using session replay
- Test your product changes with an experiment
Don't forget to brush up on PostHog basics while you're here.